of Your Website")
We are all familiar with that feeling when a button on a website seems clickable, but it is actually not. You actually clicked it thrice, and then you realized this. Imagine you are a website owner, and your visitor is facing this or any similar issue. From a visitor’s perspective, would you like to visit that site again? That will be a ‘NO’. Hence, it is important for you to know how to measure user experience of a website.
Time is precious, whether it is yours or your website visitors’. As you don’t like spending time on rage clicks and poor navigation, it is important to implement the same for your website, too. User experience (UX) metrics focus on enabling businesses to make informed adjustments to their websites. BrandLoom, India’s leading website design company, can help boost your website’s UX. This blog will revolve around how to measure user experience of a website and the other related aspects so that businesses can benefit from it.
Understanding User Experience (UX)
User experience (UX) refers to the feeling of an individual about any product or service. As for the user experience of a website, it is about what an individual feels when they visit a specific site. In the growing digitalization, every business has to have an online presence to get that competitive edge. An official site helps them to establish their presence in the online market and emphasize their vision to the new generation of tech-savvy buyers.
UX is the foundation of success in today’s businesses as it helps them to understand how visitors are responding to their website. UX is not similar to UI (User Interface). While UI focuses on the design of the CTA button, UX emphasizes the importance of the proper placement of the buttons. The key pillars of user experience are usability, usefulness, emotion, accessibility, and efficiency.
The secret to good UX lies in taking and implementing feedback. It is important to ask about the challenges your visitors are facing while navigating your site. This will help the business understand the gaps and act accordingly. Good user experience websites tend to get higher traffic, resulting in maximized sales. Before learning about how to measure user experience of a website, it is essential to decode the reasons behind this measurement.
User Experience in Web Design
When you know how to measure user experience of a website, it is necessary to keep design aspects in mind. Maintaining a clean site with clear navigation buttons can direct users to convert effortlessly. If there is any hindrance, they are less likely to proceed. Let us look at some of the key aspects to consider.
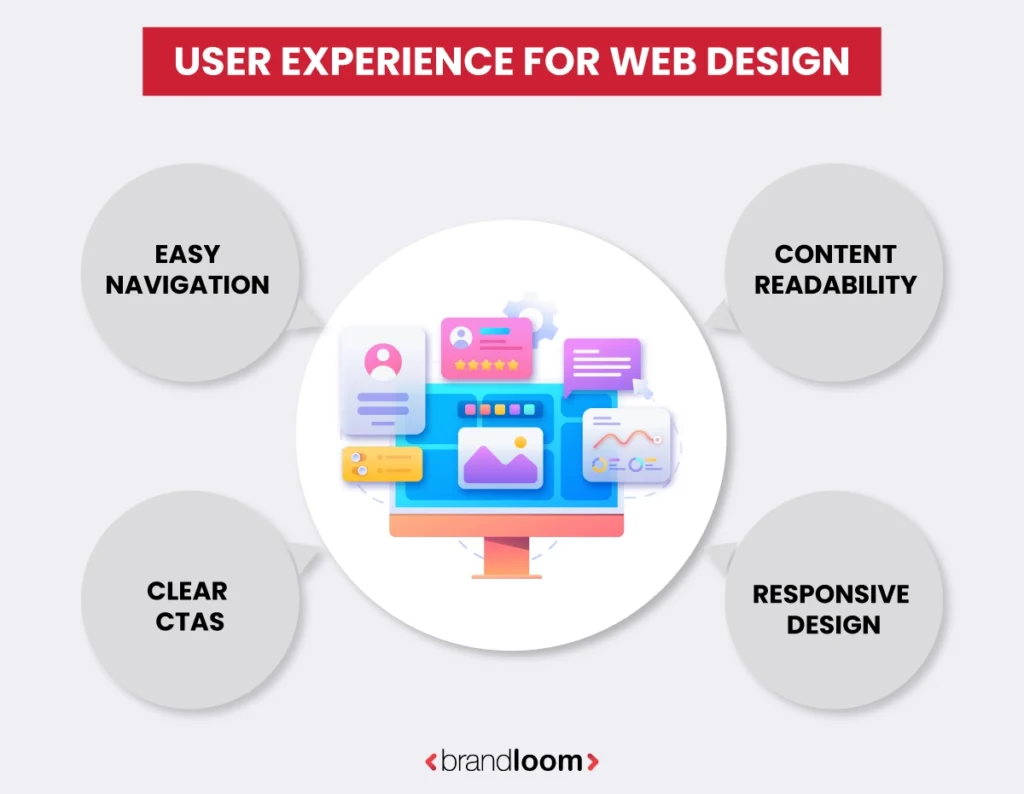
- Clear and concise content to which your target audience can relate can help brands to turn visitors into loyal customers.
- The navigation should be clean so that if a visitor decides to convert, they can seamlessly do so without encountering any confusion. Well-placed CTAs and clear buttons can work wonders.
- Heatmaps and eye-tracking are efficient in determining whether your design layout can show the correct conversion path to the users. Ease of use is a key factor to boost major actions on the site.
- Device-specific engagement metrics can reveal underlying gaps while completing a task. A website with a responsive design can maximize conversions like no other!
User Experience in Website Development
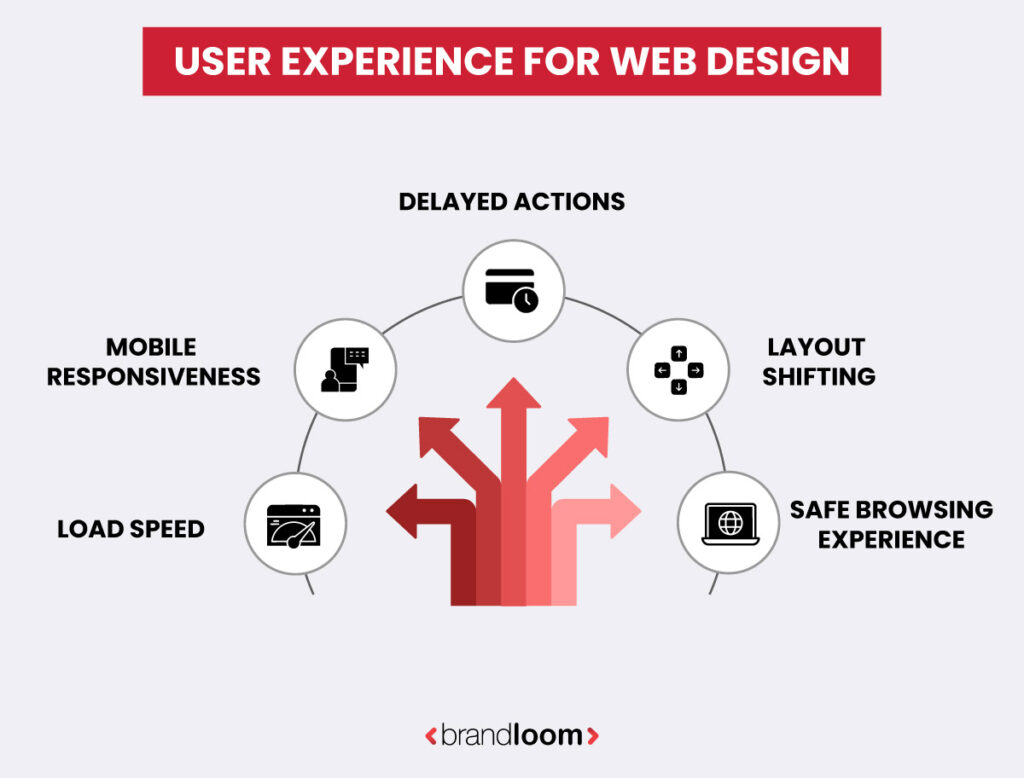
When it comes to UX in web development, it’s about how a visitor feels while navigating your site. An efficient UX will take the bounce rate and turn those into conversions. The Core Web Vitals by Google can cover all the expectations of today’s users. One small lag can turn all that convertible traffic towards your competitor’s site. Several factors shape the user experience (UX) in web development.
- If you want to build credibility right from that first click, it is important to focus on page load speed. A fast website will impress the visitors so much that they will struggle to press the exit button.
- The goal is to ensure your site opens properly on your mobile device. If it doesn’t, then you are likely to lose a large chunk of traffic that comes from mobile users. Hence, mobile responsiveness is mandatory.
- Delays can annoy the users and spoil the first impression you are planning to make. Therefore, it is essential to locate the friction points and combat interactivity and input delays.
- If your site layout shifts during major steps like sign-up or checkout, it is bad news. The users may get confused and exit your website at once. Even if they do not exit right away, they will not convert.
- When your users feel safe while surfing your site, there are higher chances of conversion. Secure browsing experience and visible trust badges are key to increasing conversion rate.
User Experience in Business
Improving user experience will make a positive impact on your business, too. But how to understand whether your website UX is working or not? Let us explore.
- Conversion rate is a direct indicator of how your business is performing at present. Negative results may call for a deeper assessment of existing gaps.
- Funnel drop-offs help you understand at what stage the users are quitting. This helps to determine the challenge in that particular stage to improve the user experience.
- Net Promoter Score NPS can be checked to understand the user satisfaction levels and the likelihood of them recommending your site to their peers.
- If your site is getting increased support tickets, that means the users are coming across challenges while completing a task. Such a website requires a UX revamp to drive lasting impact on the target market.
Key Differences Between UX and UI
Before moving forward to the next section, it is integral to learn about the differences between user experience (UX) and user interface (UI).
| User Experience (UX) | User Interface (UI) |
| 1. It is about how your website users feel about their overall experience. | 1. It focuses on how your site looks and visually responds to the users. |
| 2. The primary focus is on clarity so that the users can easily find what they are seeking. | 2. Mainly focuses on making the website attractive and easy to interact with. |
| 3. This is the primary aspect that is followed by UI. | 3. This comes after the UX. |
| 4. Heavily relies on user feedbacks and site analytics. | 4. Design software guides the process along with unique brand guidelines. |
Why Do You Need To Measure User Experience?
User satisfaction is the top priority for any business. There are multiple reasons why one must measure UX.
- This helps to identify gaps that make the users struggle. Therefore, targeted improvements can be conducted to enhance the user satisfaction rate through higher ease of use.
- UX metrics, such as conversion rates and user satisfaction scores, help demonstrate the benefits of UX enhancements to stakeholders.
- Assumptions do not bring real results. With targeted assessments and detailed feedback, businesses can make informed decisions that benefit their operations.
- User expectations change with the passing time. Frequent measurement of UX metrics enables continuous refinement of the user experience. This improves both happiness and loyalty levels.
- It is essential to meet the ever-evolving user demands. Otherwise, your business is likely to lose the competitive edge and eventually disappear from the map.
- This helps to identify minor issues, preventing them from escalating into a major problem later. Hence, there will be less cost involved and will save a lot of time of the business owners.
- UX metrics are helpful for assessing the level of inclusivity of the website. It must be designed in a way that even visitors with disabilities can navigate effortlessly. Hence, there will be more conversions.
The Core UX Metrics
Various user experience metrics help businesses assess the overall user satisfaction rate and identify any gaps. These metrics can be classified into two different categories.

1. Quantitative Metrics
These metrics include a numerical representation of the user experience of a website. Quantitative metrics are measurable and help to identify patterns or trends over a certain timeline. Some of the quantitative metrics are Task Success Rate (TSR), Time-on-task, System Usability Scale (SUS), Net Promoter Score (NPS), Error Rate, Drop-off Rate, and Click-to-Impact.
2. Qualitative Metrics
These metrics are descriptive in nature and do not involve any numerical data. Qualitative metrics help identify emotional responses and user motivations. Some of the qualitative metrics include user interviews, usability testing, session recordings, open-ended surveys, and cognitive walkthrough. This data basically involves the theories or explanations behind the events.
How To Measure User Experience of A Website?
Website UX is one of the key factors behind the overall success of your business. If you want to learn how to measure user experience of a website, you are looking at the right space.

Stage 1: Audit
Website user experience audit is the primary step to ensure the foundation is strong. Auditing performance and accessibility helps to locate minor to major gaps in the site. There are several tasks to conduct. For example, running Google Lighthouse audits for Core Web Vitals, adjusting color contrast issues, locating missing alt-texts, optimizing product images for Largest Contentful Paint (LCP), etc.
Stage 2: Critical User Journeys
The next step is tagging critical user journeys. Start with core goals identification, followed by mapping the journey steps. There will be a maximum of 5 core goals, e.g., add to cart. Implementation of event tracking via Google Analytics 4 is a key step at this stage. It is essential to set up a funnel to analyze cart abandonments and set notifications on drop-offs in conversions or error rate.
Stage 3: Session Replays
Conducting bi-weekly session replays helps to identify unexpected behaviors and early UX problems of your site. There are tools like Hotjar and Microsoft Clarity to support at this stage. A maximum of 10 sessions can be recorded for each critical user journey (CUJ). Recurring patterns like rage clicks, rapid backtracking, etc., can be identified. Each of these sessions is to be tagged with friction scores. Top friction points can help identify existing gaps.
Stage 4: Deploy Surveys
Surveys are a great way to reach out to your users and get their responses on your website. Even if anyone chooses not to respond, you can still make the assessments based on the filled-out surveys. The higher the responses, the more statistical significance this survey method will hold. It is important to find out the SEQ average. The full form of SEQ is Single Ease Question. Verbatim feedback is also essential to determine the existing challenges in your system.
Stage 5: Scorecard Calculation
This stage is all about calculating your UX scorecard to determine the overall performance of your website. It is a common way of measuring the effectiveness of user experience. There is a specific formula to follow for finding out the user experience score. If the UX score is 75 or above, then it is considered a good one. When it goes down to 59 or even below, it is a reflection of poor UX performance. A quarterly trend report can help to get insights and compare the scores for a better output.
Stage 6: Prioritize Fixes
At the last step, it is necessary to prioritize fixes with the impact-effort matrix. The high-impact ones prompt the users to make instant decisions. It is better to avoid the low-impact ones which does not involve urgency. Also, it is important to validate the process. A/B testing can be helpful for determining the overall efficiency. ROI measurement is a crucial step, followed by quarterly audits to monitor the progress.
The Top UX KPIs To Measure
Now that you are aware of how to measure user experience of a website, it is essential to learn about the most popular UX KPIs. After going through these, you can determine which one will work best for your business.
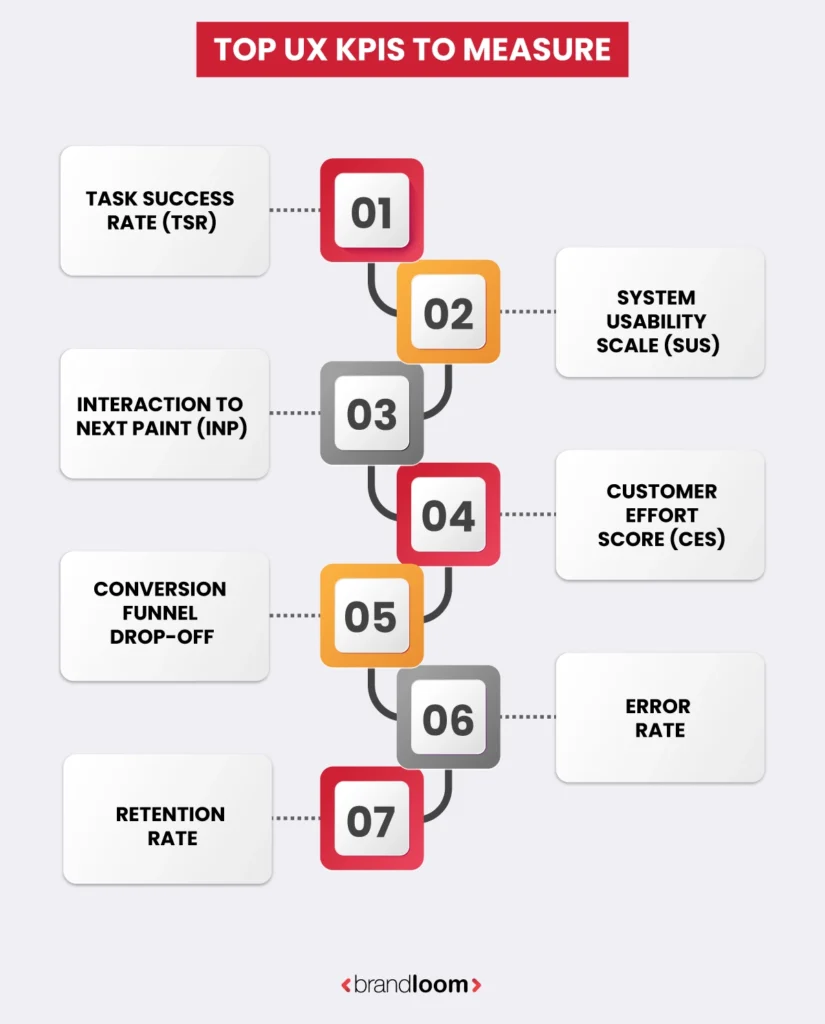
1. Task Success Rate (TSR)
This is a core usability metric that calculates the percentage of users who have successfully completed a certain task at your site or app. For example, successfully resetting the password. TSO is a direct indicator of your UX performance and whether the design is achieving its desired objectives. When you divide the number of successful attempts by the total attempts made and multiply it by 100, you will get your TSO. A good one should be above 90%. This metric works great to locate hidden friction so that necessary steps can be taken to deal with it.
2. System Usability Scale (SUS)
This metric is used to determine the ease of use of a website or application. SUS contains a 10-item questionnaire, and the users must answer it. 10 questions are to be answered on a 5-point Likert scale. If the user strongly agrees, the answer will be 5. Meanwhile, if they do not agree at all, the answer is 1. As for the odd-numbered questions, 1 should subtract from the user’s response. In the meantime, for even-numbered questions, the answer will be subtracted from 5. The target score should be somewhere between 68 and 84. The top-performing products usually score over 90. It is a widely popular KPI due to its speed and cost-efficiency.
3. Interaction to Next Paint (INP)
This KPI is highly preferable as it meets real user expectations. This is a key metric to assess real user responsiveness, which helps to shape UX. When users don’t get instant responses, they are likely to leave your site. INP not only captures the first user interaction, but it also tracks all of them. INP improvement is connected with higher conversions. The target score should be 200ms or less. A higher score is associated with mobile dominance, user retention, and increased accessibility.
4. Customer Effort Score (CES)
This is one of the most powerful KPIs as it determines how effortless your website is for the users. CES measures the input one has to give to complete a task on a site. The users rate the site on a 7-point scale. If the user gave very low effort, the score is to be 1. For maximum effort, it will be 7. The target score should be 2 or lower, thereby indicating that one had to give low effort to carry out any task on the site. A low-effort website requires fewer clicks, enhancing user satisfaction.
5. Conversion Funnel Drop-off
This KPI is integral for identifying friction points through the quantification of abandonment of key tasks. For landing pages, Conversion Funnel Drop-off reveals a value proposition mismatch. For product listings, poor discoverability is identified through this KPI. As for the stages like cart addition, checkout, and payment, it uncovers cost concerns, high cognitive load, and security fears, respectively. It helps to identify root causes by targeting the worst stages. A good score should be 15% or less.
6. Error Rate
This KPI helps with the identification of preventable user struggles. Therefore, the root cause behind the failure is exposed. Various aspects like cognitive load, business cost, efficiency, trust, and confidence, etc., make error rate one of the key KPIs to assess user experience. For example, navigation errors, such as clicking on “back” after you come across a dead end, can be quantified through error rate. The target rate should be less than 5% for a well-functioning design. For better results, this can be clubbed with qualitative data obtained from user interviews or session replays.
7. Retention Rate
This is one of the core metrics as it showcases the number of users who keep returning to your website. Therefore, it directly reflects the ongoing value and user delight. If a user comes back within a week, it shows onboarding success. If they come back within a month or so, then it’s a sign of stickiness. In the meantime, if they are returning within 3 months, it shows habit formation, that the UX is frictionless in the long term. The target retention rate should be more than 40% for mobile applications. Ongoing value, first-use success, emotional connection, and lack of friction are key aspects through which a UX design drives retention.
Leveraging UX Metrics To Improve Your Business
UX is all about enhancing user satisfaction and driving more online sales. Therefore, it is necessary to learn how to measure user experience of a website. Businesses can leverage user experience metrics to boost their growth and achieve their goals.
- Defining clear goals and aligning those with your UX metrics is important. From increasing user satisfaction to boosting conversion rates, the objective must align with the metric to work best.
- The overall efficiency lies in choosing the correct metric. A combination of attitudinal and behavioral data can help in this context.
- Various tools allow businesses to collect quantitative and qualitative data to refine the action plan further. Tools like Google Analytics or Hotjar are useful.
- Performance tracking is integral to locating gaps and implementing necessary actions. Regular analysis helps with the early detection of UX issues.
- The design needs to be changed based on the identified pain points. This will help to reduce existing user struggles.
- It is essential to keep refining UX through continuous monitoring and A/B testing. This step will maintain the continuity of effortless operations in the long run.
Want to improve your website’s user experience? Talk to BrandLoom and get a FREE UX audit for your business site today.
User Experience Measurement Frameworks
After you have learned about how to measure user experience of a website and some of the key KPIs to follow, it is turn for the frameworks. Let us check out some modern UX measurement frameworks.
1. HEART Framework
This UX measurement framework is developed by Google for the thorough evaluation and enhancement of user experience. The key purpose of the HEART framework is to align five key metrics with the business outcomes. Those metrics are happiness, engagement, adoption, retention, and task success.
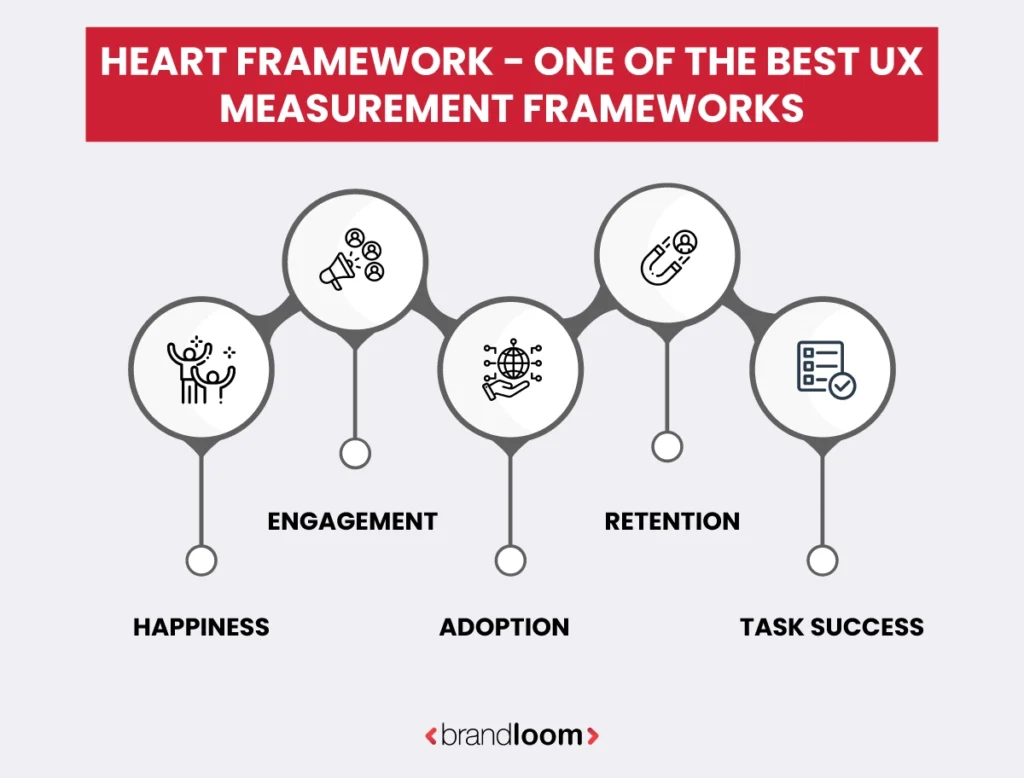
Happiness is a direct indicator of user satisfaction. Engagement is for measuring the user interaction frequency. Adoption outlines the number of new users successfully using a certain feature or product. Retention is about the users who keep coming back. Task success measures how quickly users can conduct or complete a task at your site. All of these collectively hint towards how effortless your website is for the target users.
SUS, NPS, and CES cover happiness metric, sessions/user/week helps cover engagement rate, and activation rate outlines the adoption metric. D30 retention is appropriate for covering retention, whereas TSR and error rate are ideal for measuring task success. Not every business can relate to all the metrics in the HEART framework. They have to choose the ones that align with their specific operations.
2. PURE Framework
There are 4 different criteria under this framework, e.g., pragmatic, user-centered, reliable, and economical. While the first one is about ease of measurement, the second one reflects real pain points of the users. Reliable means statistical validation is present, and low-cost tracking highlights the economical aspect. The PURE framework is best for quick optimization of critical journeys.
This framework focuses on practical usability scoring to assess the task flow hassles. The UX experts give a rating on the difficulty a user may face while completing any task on your website. There is a 3-point scale that enables the experts to analyze the friction level and determine the score. If it is at 1, then the task was easy. Meanwhile, 3 signifies task failure as it involves maximum effort from the user.
Website UX Analysis Techniques
There are core analytical methods, such as Heuristic evaluation, behavior analytics, and accessibility audit. The Heuristic evaluation aims to expertly review the site to understand whether the UX principles have been followed. WCAG 2.2 is a key tool for this. Behavior analytics tracks real user interactions by using tools like Hotjar. For design inclusiveness, an accessibility audit is ideal.
User research techniques, such as guided usability testing, session replay analysis, click/ scroll heatmaps, etc., can be utilized for UX evaluation. The key metrics for the Guided Usability Testing are TSR, SUS, etc. Dead clicks are metrics that reflect the overall performance of session replays. Also, the emotional friction score can be obtained from AI-driven sentiment analysis.
Technical performance audits are crucial to detect any underlying challenges in the design. It is essential to check aspects like mobile responsiveness, core web vitals, etc. There is a combination of methods to use to dig deeper into the root cause. For example, you can understand whether the rage clicks on your site are resulting from delays by combining INP with session replays. BrandLoom, one of the best website design agencies in India, can create a high-performing site for your business.
Best Practices to Optimize User Experience
Now that you have clearly understood how to measure user experience of a website, you are ready to optimize your UX. Let us explore some of the best practices for UX optimization.
- It is important to detect mobile-friendly thumb zones to drive clicks that eventually turn into revenue. Locate the green zones (the lower areas of your mobile screen), as these are ideal for CTA placements for mobile users. Thumb-friendly buttons, easy swipes instead of lengthy steps, etc., can boost the conversion rates.
- Make sure the INP is below 200ms, LCP is lower than 2.5s, and CLS is 0.1 or below. All these modifications can make your site perform better and boost UX. Image compression, specific space reservation for dynamic content, etc., can result in better outcomes.
- Predictive searches are preferred by modern customers. Therefore, NLP for common queries can reduce user efforts while they look for their desired product. This is highly recommended for eCommerce sites. Email triggers based on customer behavior can reduce issues like abandoned carts. For example, making them aware of any ongoing offer on the product in their cart.
- High accessibility is a must. Image alt-texts can make your task easier. Ethical designs with transparency should be the goal. Customers do not prefer hidden subscription pushes. Also, 3D product spins can enable customers to view it properly and provide your business with a competitive edge.
- Website load speed is important. Tools like GTmetrix and PageSpeed Insights can help to track ongoing performance and identify gaps. Small animations or buttons can improve UX to a great extent. Smart form validation and inline error messaging can be considered to prevent errors.
UX Measurement Strategy Implementation
Learning about how to measure user experience of a website is not everything. You must take a closer look at how things are done. Let us go through an example below:
Example: A UX Measurement Strategy For a Plus-size Apparel Brand
The goal is to improve the product purchase rate by 25% within a time span of 2 months. Here is a metric-wise plan below,
1. Conversion Rates
- How to track: Hotjar, GA4.
- Benchmark: Aim for 5-10% add-to-cart, 20-40% cart to checkout, and 60-80% checkout to purchase.
- Tip: The goal is to bring more fit-focused items after analyzing the performance of various devices and product categories.
2. Core Web Vitals & Load Speed
- How to track: GTMetrix, PageSpeed Insights
- Benchmark: Aim for LCP below 2.5 secs, INP below 200ms, page load time below 3 secs, and CLS lower than 0.1.
- Tip: For fashion brands, speed is affected mainly by image-heavy web pages, such as product pages. Compressing images to smaller sizes can help to overcome this.
3. Funnel Drop-offs
- How to track: FullStory, GA4 Funnels
- Benchmark: Aim for 30-50% from homepage to product page, 10-15% from product page to cart, and 20-30% from cart to checkout.
- Tip: Exit interview data can be utilized to understand the reasons that force them to quit, thereby identifying gaps at different funnel stages.
4. Engagement Rate
- How to track: GA4, Hotjar
- Benchmark: Aim for 3 minutes for each of the session durations.
- Tip: Recordings linked to size guidance should be checked thoroughly, as this is the highest point before the users convert.
5. CTA Clicks & Bounce Rate
- How to track: Google Tag Manager and GA4
- Benchmark: Aim for a 30-50% bounce rate, 3-5% add to cart CTR, and 5-15% size guide CTR.
- Tip: Identify UX friction points quickly by segmenting these metrics by user type, device, and source of traffic.
Conclusion
Conversion rates are greatly impacted by user experience of a website. If a visitor finds your site easily navigable and mobile-friendly, they have a higher likelihood of converting into loyal customers. Website UX is a complex area that needs due focus on all the related aspects for maximized outcomes. If you can understand everything about it, your site performance will go upwards.
This blog has covered all your queries about how to measure user experience of a website. Also, it has given all the necessary frameworks and KPIs to follow for boosting user satisfaction. Businesses can consider the best practices for UX optimization to ensure maximum ROI. Hence, if you focus on measuring the user experience, it will be easier to locate the friction points and enhance the UX for better results. BrandLoom, India’s leading web designing agency, can curate a fast, mobile-responsive, and user-friendly website for your business.
Frequently Asked Questions
User experience (UX) is a key aspect to enhance the overall performance of your site. These are the key methods on how to measure user experience of a website.
– User satisfaction or happiness level is important. A 50% or higher Net Promoter Score (NPS) is desirable. This percentage showcases the number of users who are willing to recommend your product to their peers.
– There is a standard survey of 10 items, and a 65+ score indicates a good result. This is called SUS (System Usability Score). The answers to the questions are to be given on a Likert scale.
– Emotional analysis helps to determine the happiness level, too. There are certain tools that help with AI-powered sentiment analysis.
– The feature adoption trend is popular for assessing the success of new features. Here, the percentage of users adopting the new features is outlined.
– User engagement is a major factor to assess. Frequency/ duration helps to determine the weekly sessions for each user. This is vital in assessing the success of a new update.
With the online stores climbing the popularity ladder, it has become important to analyse the connection between UX and eCommerce. Website speed is integral, as it may discourage visitors from exploring the page or making a purchase. Metrics like First Contentful Paint (FCP) and Largest Contentful Paint (LCP) analyze the speed part. Achieving higher FCP and LCP is recommended.
A mobile-responsive online store drives more sales. Thumb-friendly CTA buttons can encourage buying decisions and boost conversion rates. Gesture navigation is also a key factor in improving eCommerce UX. Image alt-texts, proper color contrast, keyboard navigation, and accessibility fixes are essential as well to make your e-store mobile-first. A semantic search option with typo tolerance helps with product discoverability and trust-building.
A good website UX is when a visitor spends more time on your site and converts into a customer. If you ask how to measure user experience of a website, there are plenty of methods. However, the goal is to boost conversions and extend the session duration for each visitor.
A visually comfortable site is likely to glue the visitors to it. In addition to this, easy navigation is the cherry on top. These two aspects work together to boost site traffic and conversions.
A low bounce rate is a sign that your target audience likes your website. It reflects that the visitors are having longer sessions, who are more likely to return later and convert even if they do not make a purchase on their first visit.
User engagement rate is also integral, e.g., likes, subscriptions, reviews, etc. BrandLoom, one of the leading website design agencies in India, can assure the highest level of UX.
Your website is the face of your business. In this digital world, when most potential buyers prefer online shopping, getting your website UX-optimized will give you a competitive advantage. There are some key user experience website design tips to follow.
– Mobile-first designs are always the top priority, as most of the target audience uses smartphones to search and purchase their desired product. CTA placement is important. Thumb-friendly zones on the mobile screen are preferable.
– Instead of leaving a blank space for search purposes, pre-fill it with examples for more clarity. This will help those visitors who are not technically sound.
– The background contrast and web content should be adjusted properly to ensure higher readability. This will extend the longer sessions.
– Breadcrumb navigation can be used to fill in the gaps caused by misnavigation. This will result in higher traffic and sales.
– Displaying trust seals at the checkout page can reduce the number of abandoned carts, maximizing conversions.
The best way to choose user experience metrics for your product is to align your business goals with the objectives of your target users. Different metrics help to achieve different business objectives. For instance, if you want to increase your conversion rates, Task Success Rate (TSR) is the ideal one. It shows the percentage of users who have successfully completed a task on your site.
System Usability Scale (SUS) and Net Promoter Score (NPS) are helpful for boosting user retention. Error rate and CES are linked to support cost reduction. While talking about different product stages, the metrics also vary based on that. For instance, TSR and CES are ideal for product launch, SUS and feature adoption work great for the growth stage, and NPS is essential for the maturity stage. BrandLoom, India’s leading website design company, helps to improve your UX based on your business goals and product stage.
Context varies based on the type of site and its purpose. For example, news websites are more likely to have higher bounce rates as the readers come for a specific article and leave after they finish. This is a usual behavior. Similarly, for blogs, users come for one blog, read it, and leave. However, in some cases, they find another blog suggestion on the same web page that matches their interest or pain point.
They open and read it. However, those blogs open on a new page. As for the eCommerce sites, high bounce rates are a negative indicator. Here, the user is expected to spend more time searching for the product, filling delivery-related details, and completing the checkout after payment. Low bounce rate means the user spent more time, and has either converted or will return soon to explore further. Also, a high bounce rate may not always be bad for landing pages.
There are different tools that can be used for user interaction tracking. Tools like Hotjar, Microsoft Clarity, FullStory, etc., can help with behavior analytics and session recordings. Hotjar detects rage clicks and gives AI-driven insights. It is ideal to measure session replays and heatmaps. If you have less budget, then Microsoft Clarity can be a good alternative. It is free and helps with cross-platform analytics and dead clicks tracking.
GA4 and Mixpanel are tools to help with product and event analytics. While GA4 has the advantage of free integration with Google Ads, Mixpanel helps with retention cohorts and funnel analysis. For performance and Core Web Vitals, Google PageSpeed Insights will be a key tool. It tracks INP, CLS, and LCP. As for Feedback and Voice-of-Customer, Sprig can be used for CES measurement post-task. BrandLoom uses various tools to ensure your site enables optimum user interaction.
When it comes to heatmaps, it is a powerful analytical tool. This reveals behavioral patterns of the users by showing where they interact more frequently on your site. This visual tool has warmer and cooler shades that imply the intensity of the activity.
As warmer colors represent the areas with the most frequent interactions, the cooler tones showcase lower engagement areas. There are different type of heatmaps to track activities like clicks, scroll, touch, and moves/hovers.
This is a great tool to highlight the key differences between user segments and traffic sources. Hence, it contributes to targeted optimizations. BrandLoom, India’s best website design agency, can locate gaps in your site and enhance its performance through well-optimized design.
A combination of metrics should be followed to measure mobile UX. TSR or Task Success Rate helps to determine whether the users are struggling to complete key tasks on your website from their mobile. Time-on-task reflects the total time spent by the user to complete a certain task from a mobile device. This focuses on understanding ease of use. Hence, the website can be optimized accordingly for mobile users.
Site speed is integral to driving sales. Therefore, load time is a key metric to consider. If your site loads faster on a mobile device, it is a sign of positive UX. Retention rate is crucial as it highlights how many users are finding your site helpful and keep coming back for more. Abandonment rate locates the drop-off point where most users tend to quit and leave. This helps to work accordingly on the design to extend their stay and boost conversions.
Before finding out about how to measure user experience of a website, it is essential to learn about the UX pain points. There are certain factors to consider. A site with a high bounce rate indicates that users are visiting but leaving without taking any action. In such a scenario, website load speed, messaging, mobile responsiveness, etc., should be checked and changed accordingly.
Low conversions are an indicator of poor navigation or a lack of user-friendliness. If the users are interacting but leaving without taking any action, then there is a UX gap. Rage clicks point towards confusing content or navigation. Session recordings or heatmaps should be checked for gaps. If your website visitors are experiencing something similar, get in touch with BrandLoom today!
While it can be tempting to obsess over batting average, it doesn’t really mean a whole lot if you’re ignoring UX metrics that reflect user behavior and happiness as well as your usability. One of the key signs of success is an enhanced conversion rate. If more people are signing up, completing purchases, or taking the action you want them to take, they’re getting a strong signal that the experience is now smoother, more intuitive, or more persuasive.
Another consideration is how easy it is for users to complete their task. If you’ve redesigned a form, reorganized your site navigation, or simplified a checkout process, you should start seeing more users follow through to the finish line without dropping out. This sort of improvement confirms that people are no longer hitting the wall. Bounce rate is another factor to check out for