Often, the Google Ads dashboard looks incredible, your ROAS is at 6x, and your cost per acquisition is the lowest it has been all year. Everything looks like a win. But then you look at your actual profit. And the numbers don’t add up.
This is the situation more business owners find themselves in than most people want to admit. The gap between performance marketing and profit is real, and it is quietly draining businesses that think they are doing everything right. High-performing campaigns and profitable growth are not the same thing, and confusing the two is one of the most expensive mistakes a brand can make today.
Global digital ad spend crossed $790 billion in 2024, yet most brands still cannot draw a straight line from a single campaign to actual revenue growth.
Yet 81 percent of organizations say they track customer lifetime value, but only 37 percent actually use it to make decisions. The average brand runs campaigns across five or more channels and still cannot connect any of them to real revenue outcomes. So the question worth asking is not whether your marketing is working. The real question is what exactly it is working towards.
We will break down why high-performing campaigns often fail to drive actual business profit, where the performance illusion comes from, and what a proper marketing ROI strategy with a good company such as BrandLoom actually looks like for brands serious about long-term growth.
Why the Gap Exists in Performance Marketing vs Profit?
Performance marketing was built to measure activity. Clicks. Impressions. Conversions. It is a system designed to tell you how efficiently your ad spend is generating outcomes at the top and middle of the funnel. And it does that job well.
The problem is that efficiency and profitability are two entirely different things. A campaign can be incredibly efficient at generating sales that still cost the business money once you factor in returns, fulfillment, discounts, and the long-term behavior of the customer you just acquired.
Why Is ROAS vs. Profitability Not the Same Conversation?
| Performance Metrics | Profitability Metrics |
| ROAS (Return of Advertised Sales) | Contribution Margin |
| CPA (Cost Per Acquisition) | Customer Lifetime Value (LTV) |
| CTR (Click Thru Rate) | Net Profit |
| Impressions | Customer Retention |
| Revenue | Revenue Per Customer |
Take ROAS as a starting point. A 6x ROAS sounds like a strong result. For every rupee you spend on ads, you generate six rupees in revenue. But ROAS measures revenue efficiency, not business profitability.
- If you are selling low-margin products, running heavy discounts to drive volume, or acquiring customers who return the product 40 percent of the time, that 5x ROAS can still leave you with a net loss after you account for actual costs.
- The same logic applies to cost per acquisition. A low CPA looks like good news on a dashboard. But if the customer you just acquired at a cheap rate never buys again, the economics fall apart quickly.
- You spent money to bring in someone who handled one transaction and then left. The acquisition was efficient. The business outcome was not.
This is the heart of the performance marketing vs profit debate. Performance metrics are inputs. They describe the mechanics of your campaigns. Profitability metrics are outcomes. They tell you whether the business is actually better off.
The Performance Trap Most Brands Never See Coming
The conversation between vanity metrics vs profit does not happen often enough in boardrooms. Metrics like impressions, reach, engagement rate, and total revenue look compelling in a report. They create a feeling of momentum. They get featured in monthly reviews. But they can mask a business that is quietly running at a loss.
Here is a simple way to think about it.
- Impressions tell you how many people saw your brand.
- Click-through rate tells you how many people clicked.
- CPA tells you how cheap a customer was to get.
- ROAS tells you how much revenue your ad spend generated.
- Engagement rate tells you how many people interacted.
- Total revenue shows top-line growth.
- Monthly traffic shows volume.
What none of those metrics tells you is whether the people who clicked became profitable customers. They do not tell you if the revenue you generated had any margin left in it. They do not tell you whether those customers came back or disappeared. They do not reveal how long it takes to recover what it costs to acquire someone in the first place.
Revenue vs Marketing Performance: What the Numbers Are Actually Hiding
The conversion rate by cohort shows how many clicks converted into profitable customers over time. The CAC-to-LTV ratio indicates whether a customer was genuinely worth acquiring. Contribution margin per sale shows the profit remaining after every variable cost, not just ad spend. The retention rate tells you how many people came back.
According to McKinsey, companies that use customer analytics comprehensively are 2.6 times more likely to have higher profits than their competitors. Yet, the majority of marketing teams still report on reach and engagement as their primary success metrics.
Optimizing for efficiency cannot make up for ignoring revenue vs marketing performance at the outcome level. The brands that figure this out early are the ones that scale without constantly burning budget to replace customers they should have kept.
What Metric Relationship Determines Marketing ROI Journey?
If there is one number that reveals more about the health of your marketing than anything else, it is the ratio between customer acquisition cost and customer lifetime value.
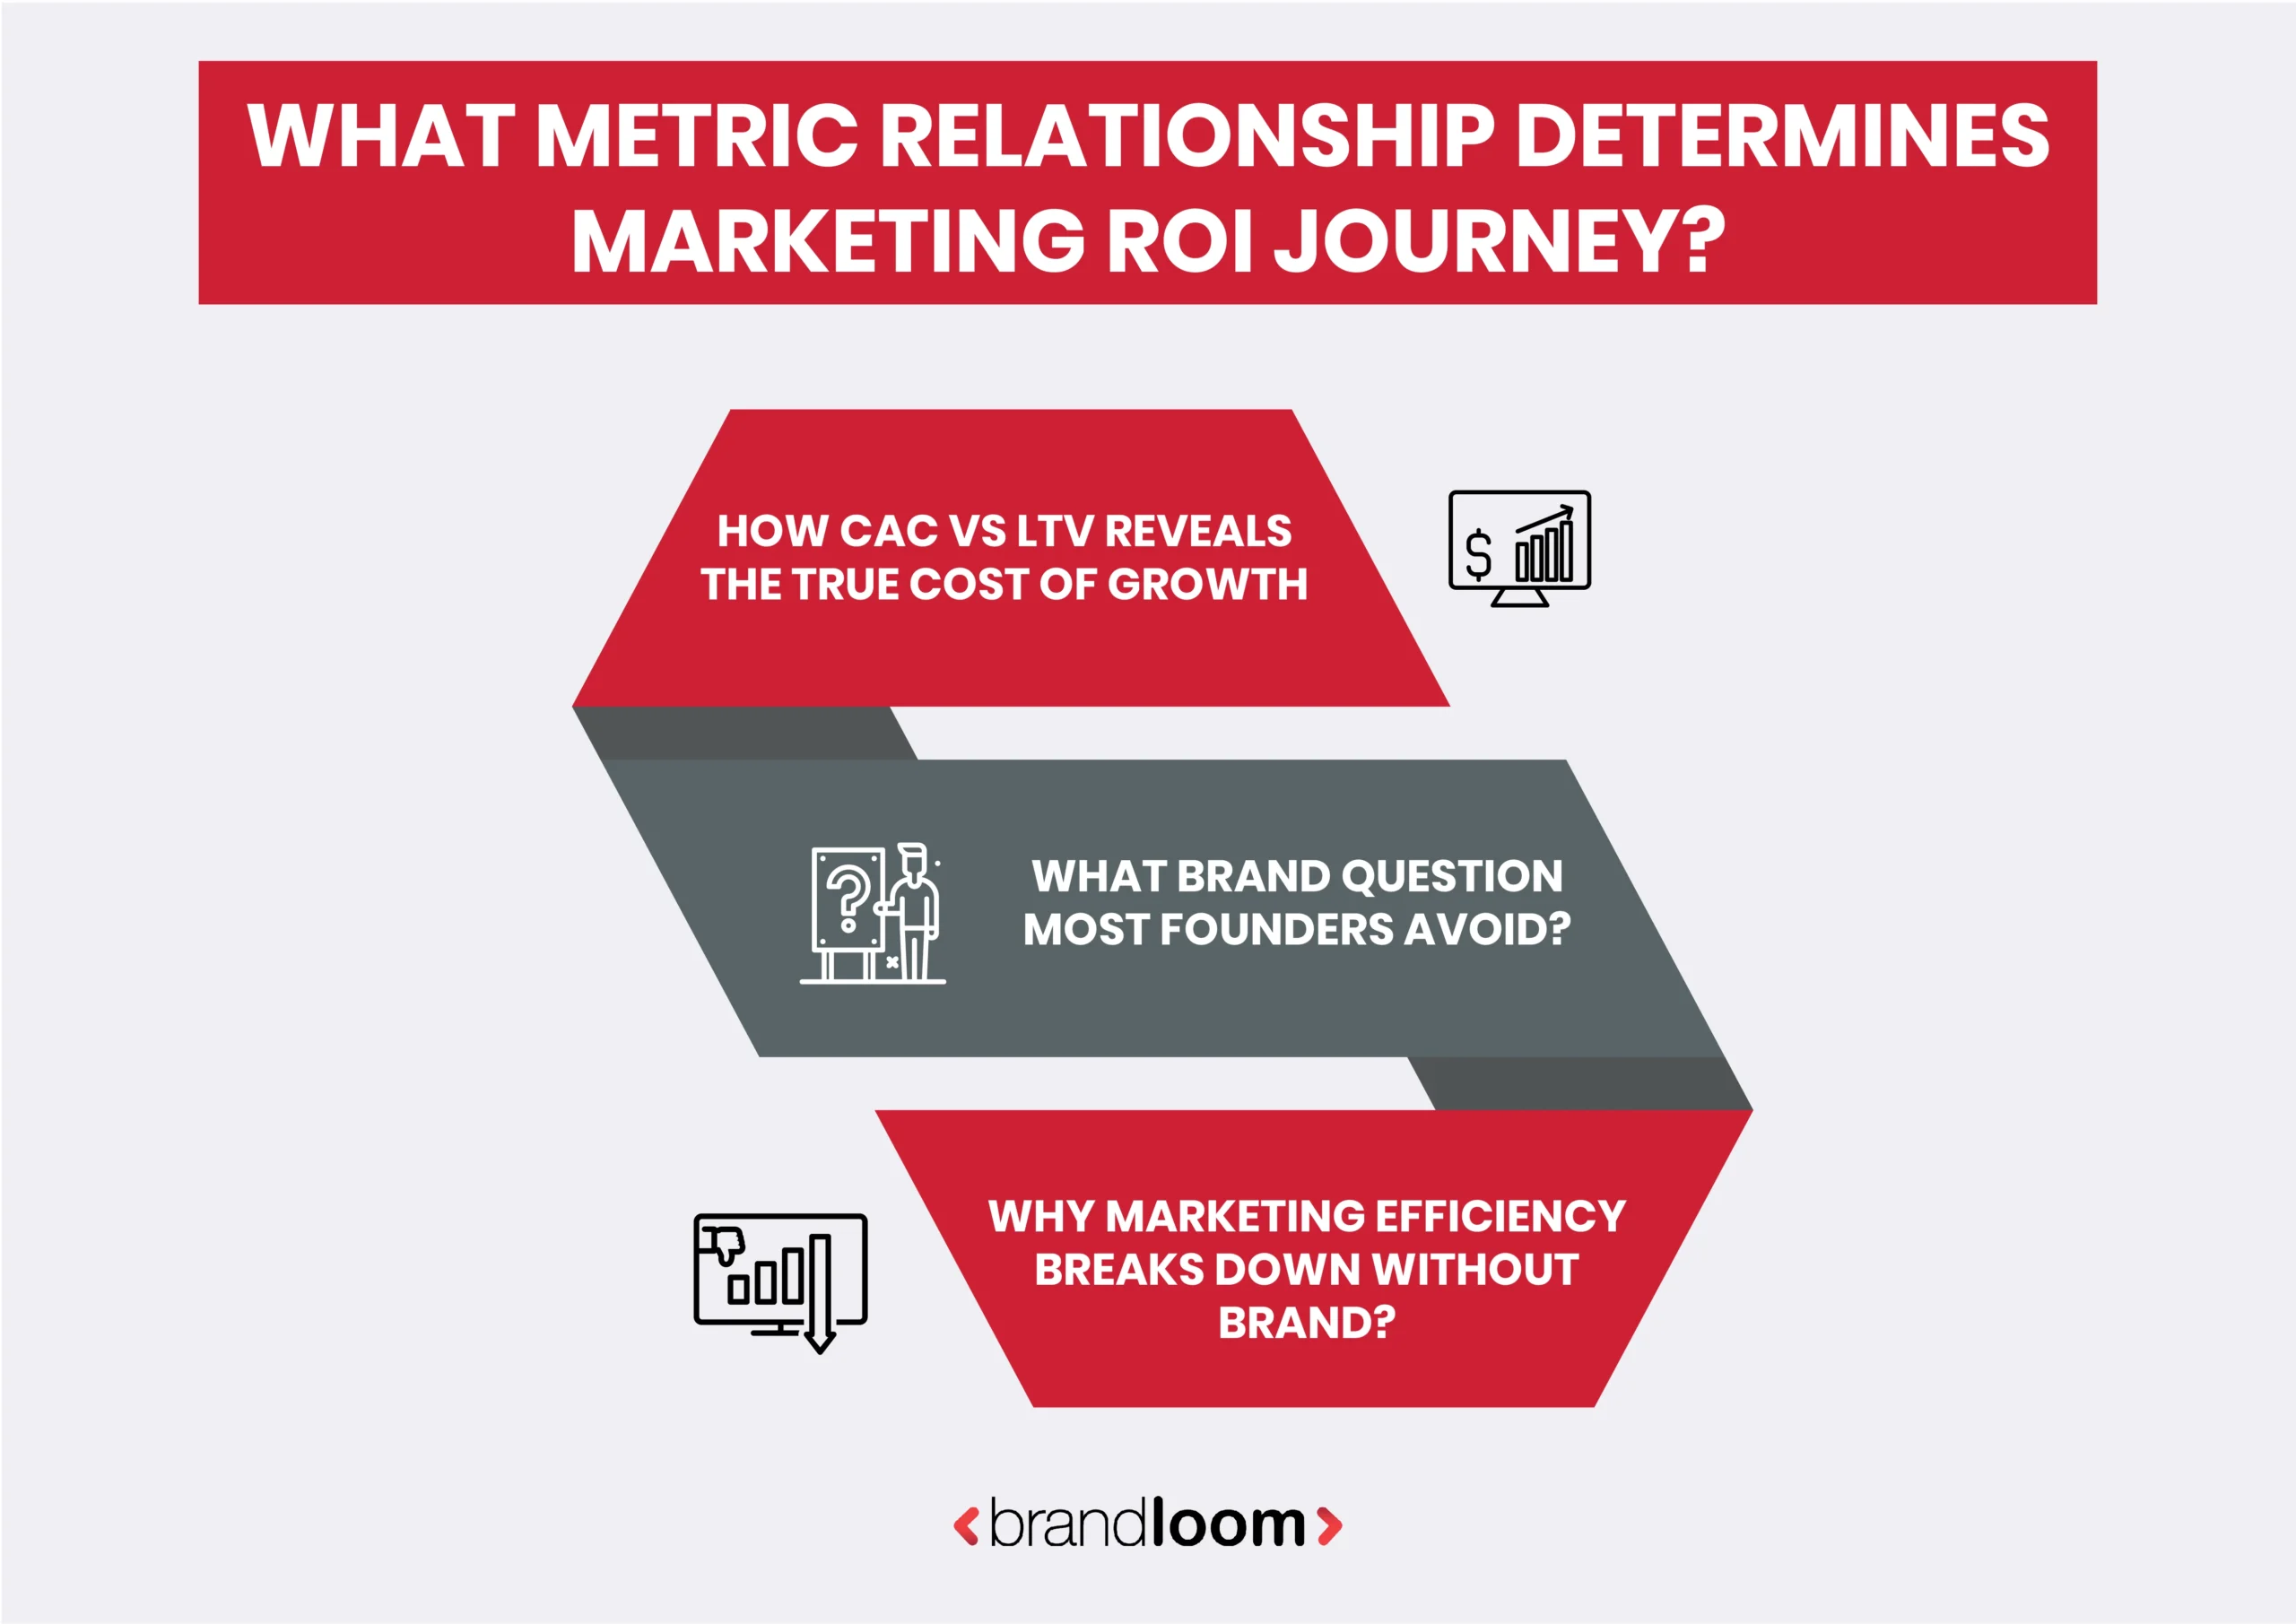
How CAC vs LTV Reveals the True Cost of Growth
A healthy LTV-to-CAC ratio is 3-to-1 or better. For every rupee spent acquiring a customer, you should expect to get three rupees of net value from that relationship. Below 1-to-1, you are losing money on every customer you bring in, and no amount of efficient ad spend can fix that.
Payback period is another critical metric. With an 18-month recovery time, you constantly struggle with cash flow. But shorter periods let you reinvest faster, feel more secure about growing, and handle dips in performance way better.
Bain and Company research shows that increasing customer retention by just 5 percent can increase profits by 25 to 95 percent, making the CAC vs. LTV ratio one of the highest-leverage metrics in any marketing operation.
The real trap is not spending too much on acquisition. It is acquiring the wrong customers. Cheap to bring in, low-margin purchases, high return rates, zero repeat purchase intent. That combination produces a business that appears active on the surface but is quietly deteriorating beneath the surface.
Segmenting CAC targets by expected LTV per product category is one of the most practical steps any marketing team can take to connect campaign decisions to business outcomes.
Why Marketing Efficiency Breaks Down Without Brand?
Without a clear, differentiated brand, performance marketing is like fishing from a shrinking pool. Every time someone encounters your ad without prior familiarity with your brand, the friction is higher. The click-through rate is lower, and the conversion rate drops. The cost per acquisition creeps upward. And because there is no brand equity building in parallel, you keep paying to reintroduce yourself to the same audience over and over.
Research from the Ehrenberg-Bass Institute shows that meaningfully different brands achieve up to five times the market penetration of undifferentiated competitors, and brands with big meaningful differences can command up to twice the average category price point.
Consistent brand presentation across channels can increase revenue by up to 23 percent without any additional ad spend. The right model is not brand or performance. It is brand, then performance, running in parallel. Brand builds predisposition before performance reaches buyers. At the moment of purchase, the buyer has already been influenced long before they clicked on an ad.
Brand clarity also removes internal waste. A clear brand compresses the sales cycle because buyers spend less time evaluating and more time deciding. When the value proposition is unclear, your messaging cannot land, regardless of how well-targeted the media is. This is where marketing efficiency at the campaign level gets undermined by a strategic gap at the brand level.


Profit-Driven Marketing: The 3 Shifts That Actually Change the Outcome
Fixing the disconnect between performance marketing and actual profit is not about abandoning the metrics you already track. It is about adding the right layer of outcomes thinking on top of them. Here are three shifts that make a measurable difference.
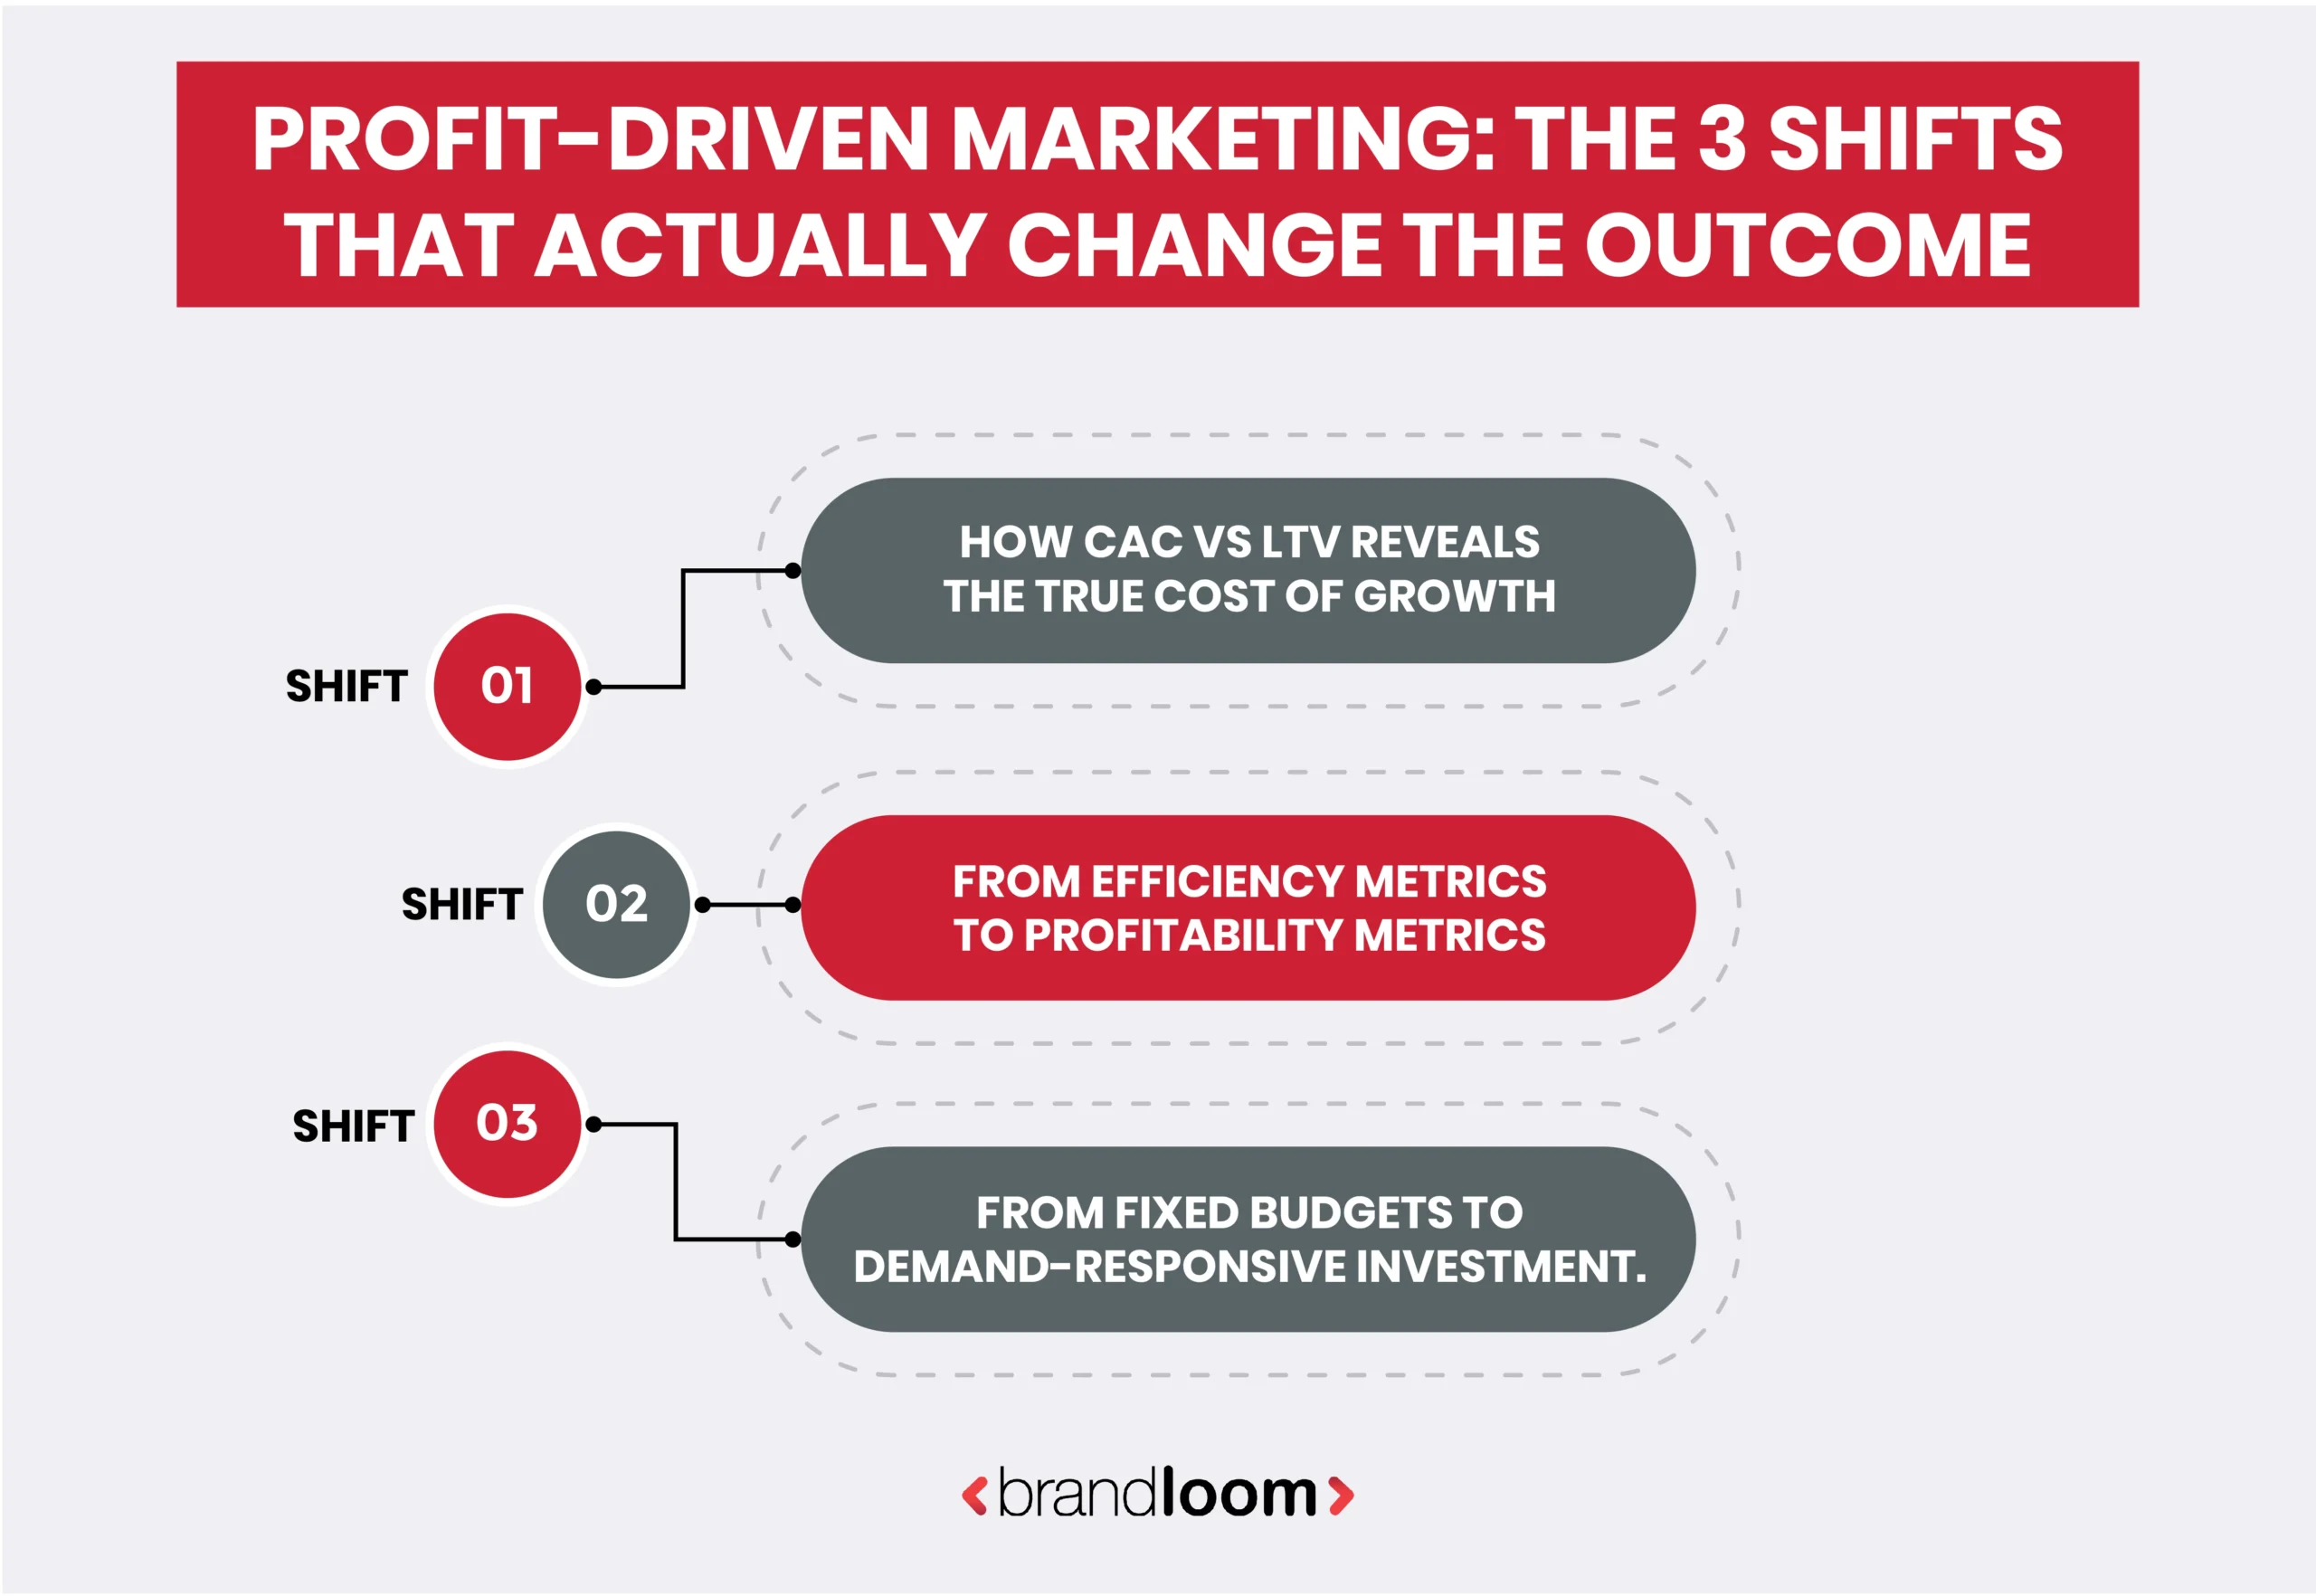
Shift 1: From campaign thinking to customer lifetime thinking.
Most marketing teams organize around campaigns. Launch, measure, optimize, repeat. But campaigns are a temporary lens; customer value is not. The shift is to segment customers by profitability, not just demographics, to build retention into the strategy from the beginning, and to track Net Revenue Retention as a headline metric. Post-purchase marketing matters here, too. Reinforcing the customer’s decision after they buy reduces churn, increases the likelihood of a second purchase, and improves the LTV metrics your acquisition economics depend on.
Shift 2: From efficiency metrics to profitability metrics.
This means tracking the contribution margin per sale, which is the profit remaining after all variable costs, not just ad spend. It means measuring LTV-to-CAC by product category and customer segment rather than as a single blended number. It means making the payback period visible to business leadership. And it means aligning marketing KPIs with the profit and loss statement so that marketing performance is evaluated against business financial outcomes, not its own internal benchmarks.
Shift 3: From fixed budgets to demand-responsive investment.
Fixed monthly ad budgets are a legacy habit from a time when spend was harder to adjust in real time. The better approach is to keep spending as long as you can make a profitable return and pull back when the marginal customer costs more than they are worth. This means matching spend to real-time demand signals, including paid search trends, seasonal data, and audience intent. It means concentrating acquisition budget behind hero products. And it means having the discipline to stop campaigns that acquire low-margin, high-churn customers, even if those campaigns look fine on a ROAS basis.
Improve Marketing ROI by asking Questions Every CEO Should Ask?
If you want a fast way to diagnose whether your marketing is driving growth vs profitability, before increasing marketing budgets, every leadership team should be able to answer these three questions.
Are your best-performing campaigns actually profitable or just efficient?
The real test of a campaign is not how cheap the clicks were. It is how profitable the customers were six months after acquisition. If your team cannot answer that question, you have a measurement gap that is likely costing real money.
What is the LTV to CAC ratio of the customers you are acquiring?
Different products, channels, and customer segments produce very different ratios. Knowing which ones are healthy and concentrating investment there is one of the highest-leverage decisions a leader can make. If this number is not on your regular reporting dashboard, it is worth fixing this quarter.
Is your brand clear enough to command the price you are charging?
A fragmented brand makes price the only differentiator, compressing margins and increasing CAC over time. Brand clarity is not a marketing department problem. It is a business strategy problem because it directly determines pricing power, retention, and ultimately profitability.

What a Real Profit-Driven Marketing Strategy Looks Like in Practice?
Profit-driven marketing is not a new channel or a new tool. It is a different way of framing what marketing is supposed to do for a business.
- At the foundational level, it starts with the right metrics. Customer acquisition cost, conversion rate, average order value, gross margin, and net contribution margin provide a baseline picture of what each sale actually earns after deducting all variable costs.
- At the intermediate level, you add retention rate, customer lifetime value, and payback period. These are the numbers that tell you whether customers are building a business or just filling short-term revenue targets.
HubSpot research found that companies prioritizing customer retention and LTV-focused marketing see 60 to 70 percent lower customer acquisition costs over three years compared to brands that optimize purely for new customer volume.
- At the advanced level, you track the LTV-to-CAC ratio, Net Revenue Retention, and net profit per customer cohort. That last one is particularly revealing because it shows the profitability of customers acquired in the same period.
Brands that sustainably improve marketing ROI are not necessarily spending more or less than their competitors. They are spending more intelligently, measuring outcomes rather than activities, and treating brand investment as a strategic input to performance rather than a luxury to be deferred.
Foundational Metrics Every Business Owner Should Track
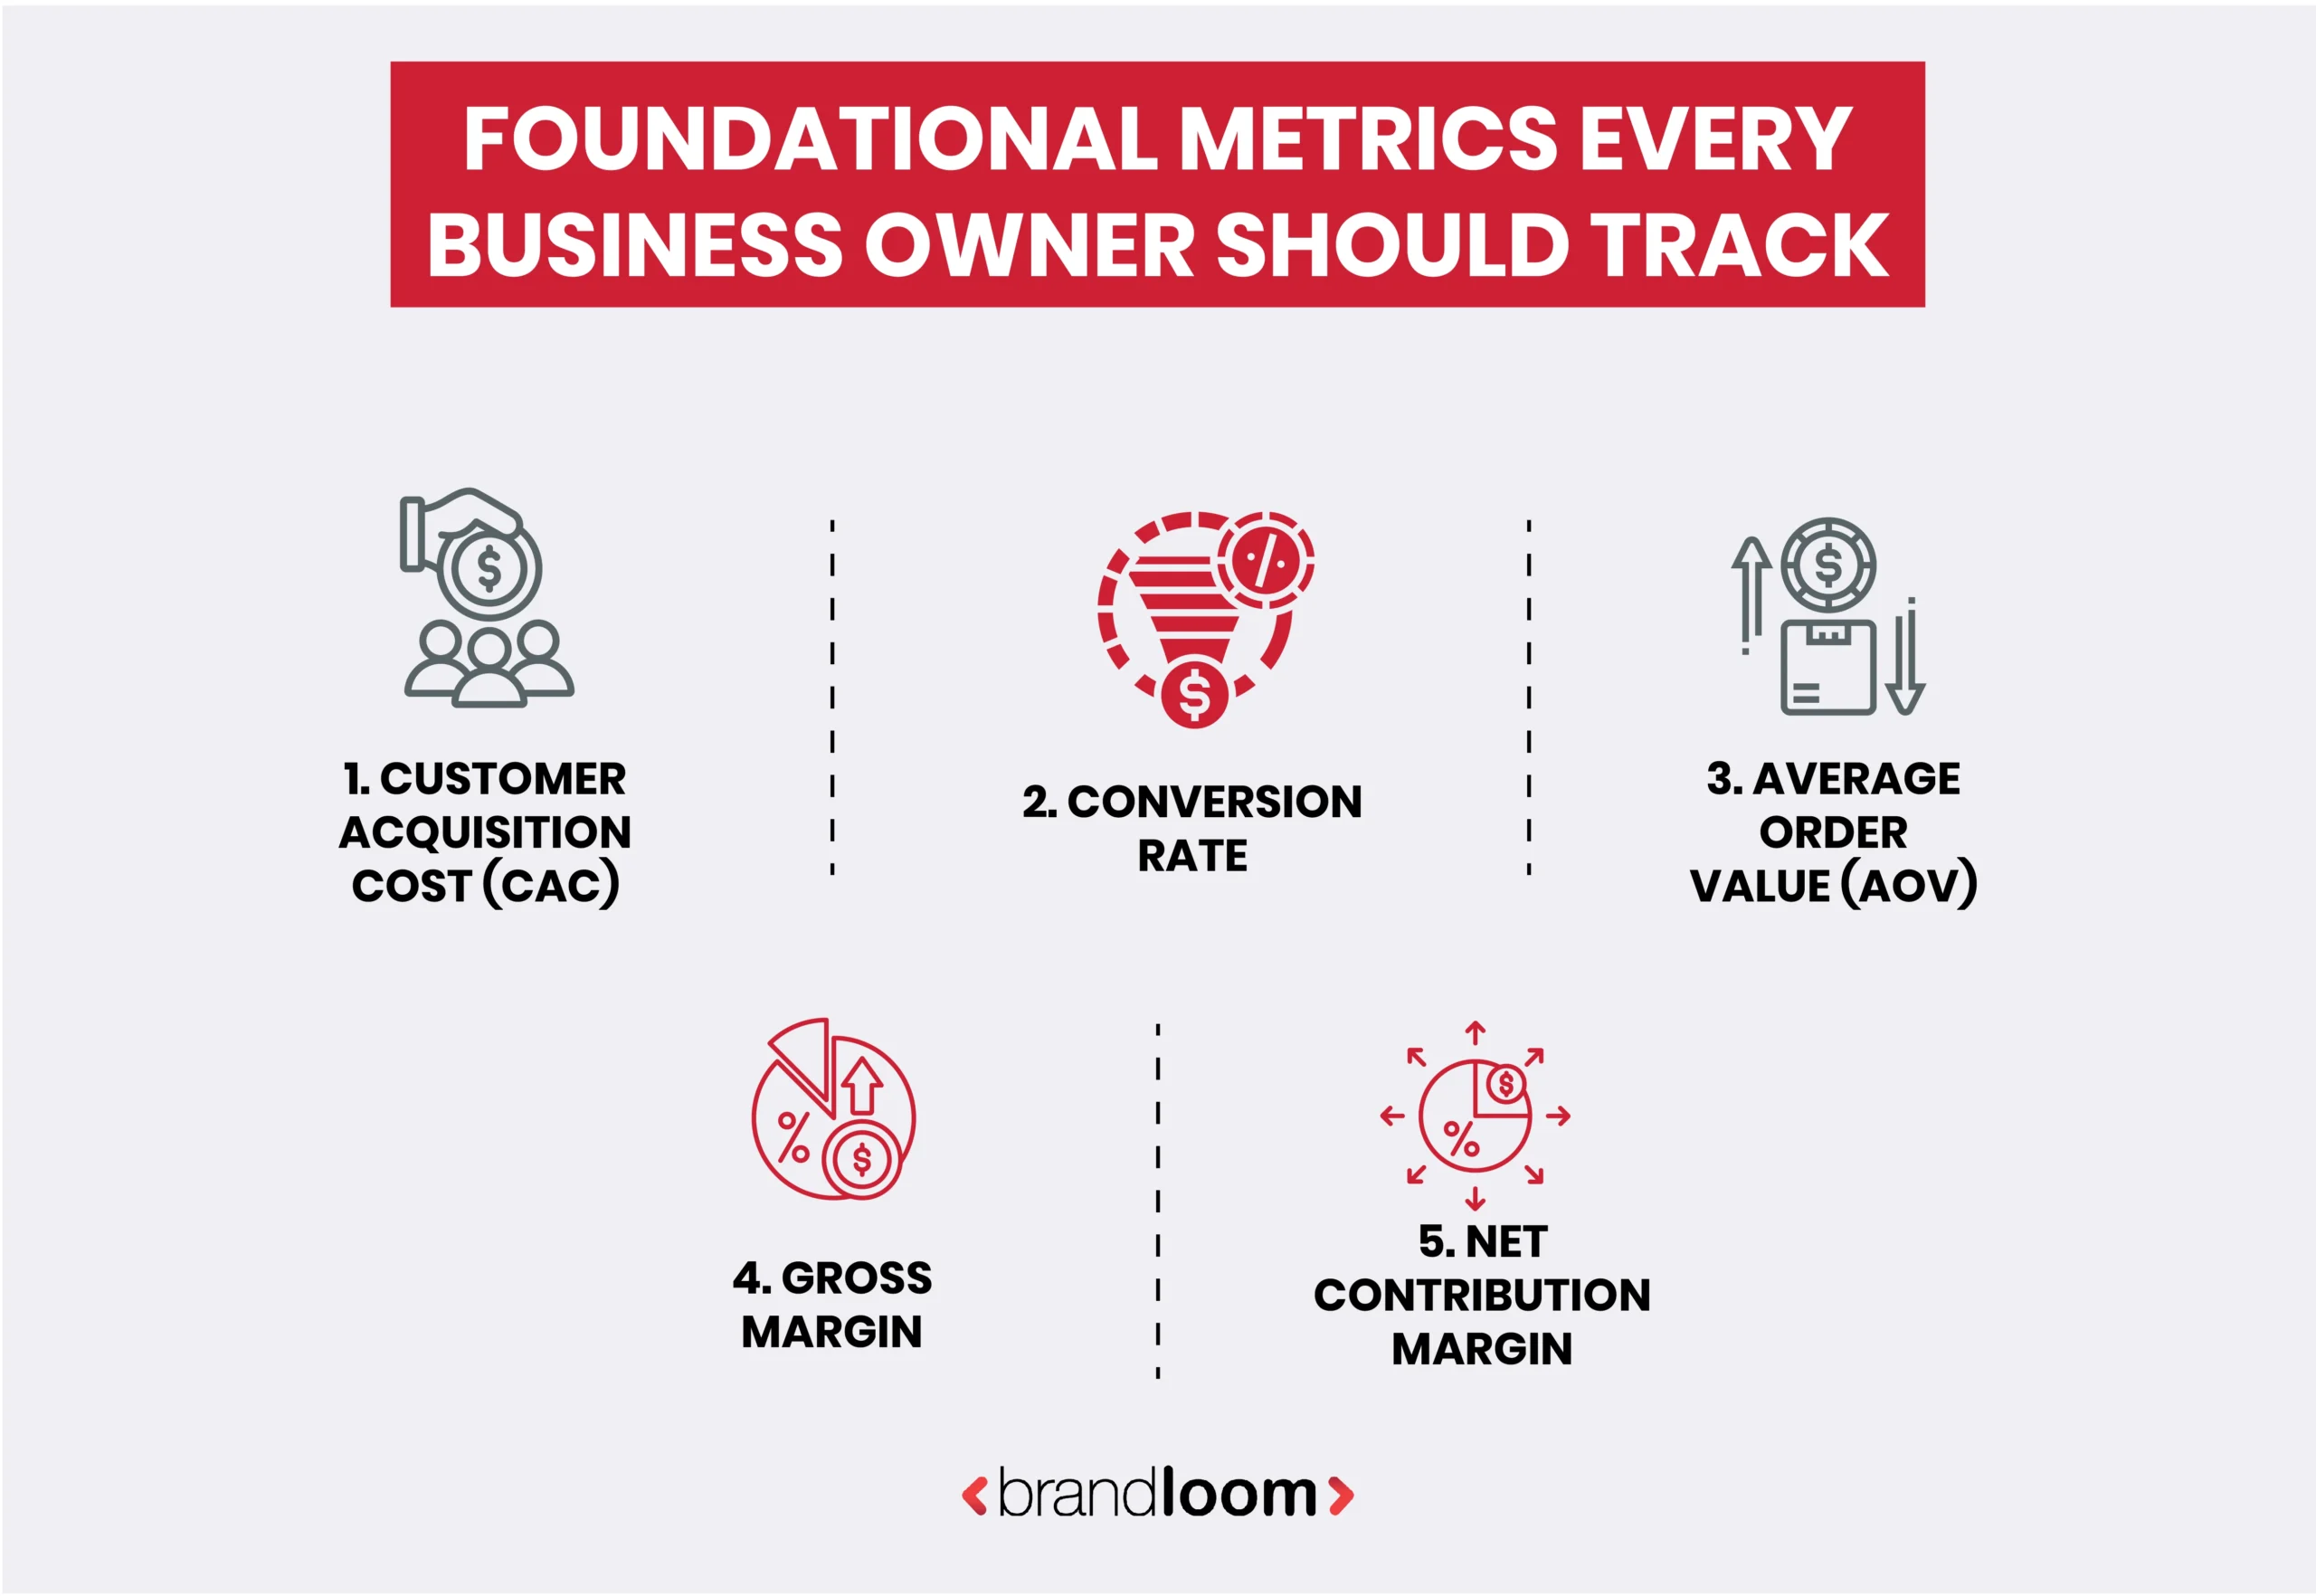
1. Customer Acquisition Cost (CAC)
This is the total amount you spend to bring in one new customer across all channels, including ads, salaries, tools, and everything else. Most brands only count ad spend and end up with a number that looks healthier than it actually is. The real CAC is almost always higher than what shows up on the dashboard.
Why track it: It tells you the true price of growth. If you do not know what it costs to acquire a customer, you cannot make a rational decision about how much to spend.
Red flag: CAC rising quarter-on-quarter with no improvement in LTV. That means you are paying more for customers who are not worth more. That is a slow bleed most brands catch too late.
2. Conversion Rate
The percentage of people who take the action you want, whether that is a purchase, a sign-up, or a lead form. It sounds simple but most brands track it as one blended number across all traffic sources which hides more than it reveals.
Why track it: It shows how well your funnel is actually working. A high conversion rate means your messaging, offer, and audience are aligned. A low one means at least one of those three is broken.
Red flag: High traffic with low conversion. This almost always means you are either reaching the wrong audience or your landing experience is not matching what your ad promised. Spending more on ads in this situation just accelerates the waste.
3. Average Order Value (AOV)
The average amount a customer spends per transaction. This one tends to get ignored because it feels like a merchandising metric rather than a marketing one. That is a mistake.
Why track it: Higher AOV means more revenue from every customer you already paid to acquire. It is one of the most efficient ways to improve profitability without touching your acquisition budget at all.
Red flag: Flat or declining AOV while your ad spend is going up. It means your growth is coming purely from volume, and volume-driven growth with thin margins is one of the most fragile business models there is.
4. Gross Margin
The profit remaining after you subtract the cost of goods sold from your revenue. Before any marketing spend, before salaries, before overheads, just revenue minus what it cost to make or source the product.
Why track it: It tells you how much room you actually have to invest in growth. A business with 20% gross margins and a business with 60% gross margins need completely different marketing strategies. Treating them the same is how brands end up with a growth plan that mathematically cannot work.
Red flag: Margins are compressing while revenue is growing. This is a profitability crisis in slow motion. It looks like success on the top line, and it is quietly destroying the business underneath.
5. Net Contribution Margin
This is the profit left after every variable cost is removed, not just the cost of goods, but returns, discounts, fulfillment costs, payment processing fees, and any variable cost tied directly to the sale. It is the truest picture of what a single sale actually earns the business.
Why track it: ROAS and even gross margin can look healthy while net contribution margin is barely positive or even negative. This is the number that tells you whether a campaign is actually making money for the business or just generating revenue that disappears once all costs are accounted for.
Red flag: Strong ROAS but weak net contribution margin. This is the performance trap in its purest form. The campaign looks like it is working. The business is not growing. The gap between those two things lives exactly here.
The Bottom Line on Performance Marketing vs Profit
Strong campaign performance is valuable, but it only creates business growth when it translates into sustainable profitability. The brands that consistently outperform competitors measure not only how efficiently they acquire customers, but also how much long-term value those customers generate.
If your campaigns are delivering strong performance numbers but your business growth is not keeping pace, the gap between what your metrics show and what your P&L shows is exactly where the problem lies. And that gap is solvable, but only if you start asking the right questions.
BrandLoom helps businesses improve their return on investment (ROI) by operating as a dedicated, data-backed, and results-driven marketing and branding firm. If you want a clearer picture of where your marketing ROI is coming from and where it is leaking away, a conversation with our team is a good place to start.
Frequently Asked Questions
Performance marketing measures how efficiently campaigns generate clicks, conversions, and revenue. Profit measures what is left after all costs are accounted for. Strong dashboard performance does not automatically translate to business profitability. That gap between what your metrics show and what your P&L says is exactly what BrandLoom’s profit-driven framework is built for.
Most campaigns are optimized for efficiency metrics such as ROAS and CPA rather than profitability metrics such as contribution margin and LTV. When you optimize for the wrong outcomes, you get campaigns that look strong on paper but do not improve the business’s financial health.
Vanity metrics seem impressive, but don’t show whether a business is growing profitably. Things like impressions, reach, and engagement rates fit this bill. Top-line revenue can also become a vanity metric when viewed without considering margins, customer lifetime value, and profitability.
Focus on tracking each sale’s contribution margin instead of only ROAS. Also, keep an eye on the LTV-to-CAC ratio for different products and channels. Make sure the payback period is clear to leadership, too. Lastly, prioritize marketing spends on high-margin items that people re-order most. You can try changing strategies with good P&L outcomes, so the right data is available for every budget decision
ROAS measures revenue per rupee of ad spend. It does not account for product margins, return rates, fulfillment costs, or whether acquired customers ever buy again. Strong ROAS on low-margin products with high churn can still produce a net loss.
If your customer acquisition cost exceeds the customer’s lifetime value, every sale weakens the business. Healthy unit economics require an LTV-to-CAC ratio of at least 3:11 and a payback period short enough to support reinvestment without straining cash flow.